Lesson reading
live
45 min
Start with the lesson question, connect the representations, and test the model with evidence.
Inspect the opening phenomenon
Predict what changes, then name the evidence.
Apply in the lab
Name the evidence before reading the answer.
Read only what helps
Then use the lab and recall check.
More when needed
Transcript and resources stay available below.
Course progress
Noise, Delay, and Safe Stopping
Decision challenge
Use the opening example to make a prediction, identify evidence, and explain which model supports it.
Predict whether reaction or braking distance grows with speed squared.
Stopping begins with detection, but the robot travels during delay and braking.
Before
Predict whether reaction or braking distance grows with speed squared.
During
Track reaction travel, braking travel, and margin.
After
Explain why a smooth signal may still be unsafe.
Lesson reading
live
45 min
Video script
draft
1080x1920
Transcript fallback
available
courses/ai-robotics/modules/05-feedback-and-control/lessons/03-noise-delay-and-safe-stopping/video-transcript.md
Build a Stopping-Distance Budget
draft
30 min
Mastery check
live
7 questions / 10 min
# Video transcript Why can a robot keep moving after stop? Because sensing and computation take time, and the body still needs distance to brake. At one point two metres per second with a quarter-second delay, reaction travel is zero point three metres. With two metres per second squared deceleration, braking adds zero point three six metres. That is zero point six six metres before uncertainty margin. Noise makes readings jitter. Delay makes them old. Filtering may reduce jitter but add lag. A watchdog handles stale data; an independent stop path avoids waiting for the planner. Software monitoring is not safety certification. Which term grows with speed squared: reaction or braking distance?
Reading lab
Connect the lesson's words, diagrams, graphs, evidence, and equations.
A robot does not react at the instant the world changes. A sensor samples, software transports and processes the sample, the controller decides, the actuator responds, and the body decelerates. The total distance before rest is therefore more than braking distance.
You will be able to:
Noise changes the reported value even when the physical state is similar. Delay makes a correct measurement describe an older state. Filtering may quiet jitter, but an overly slow filter can add lag. Saturation means a controller cannot command more than the actuator can deliver.
Use this evidence chain:
sense → timestamp → transport → estimate → decide → command → brake → verify stopped
If any link is stale, missing, or bounded, the robot needs a defined safe response.
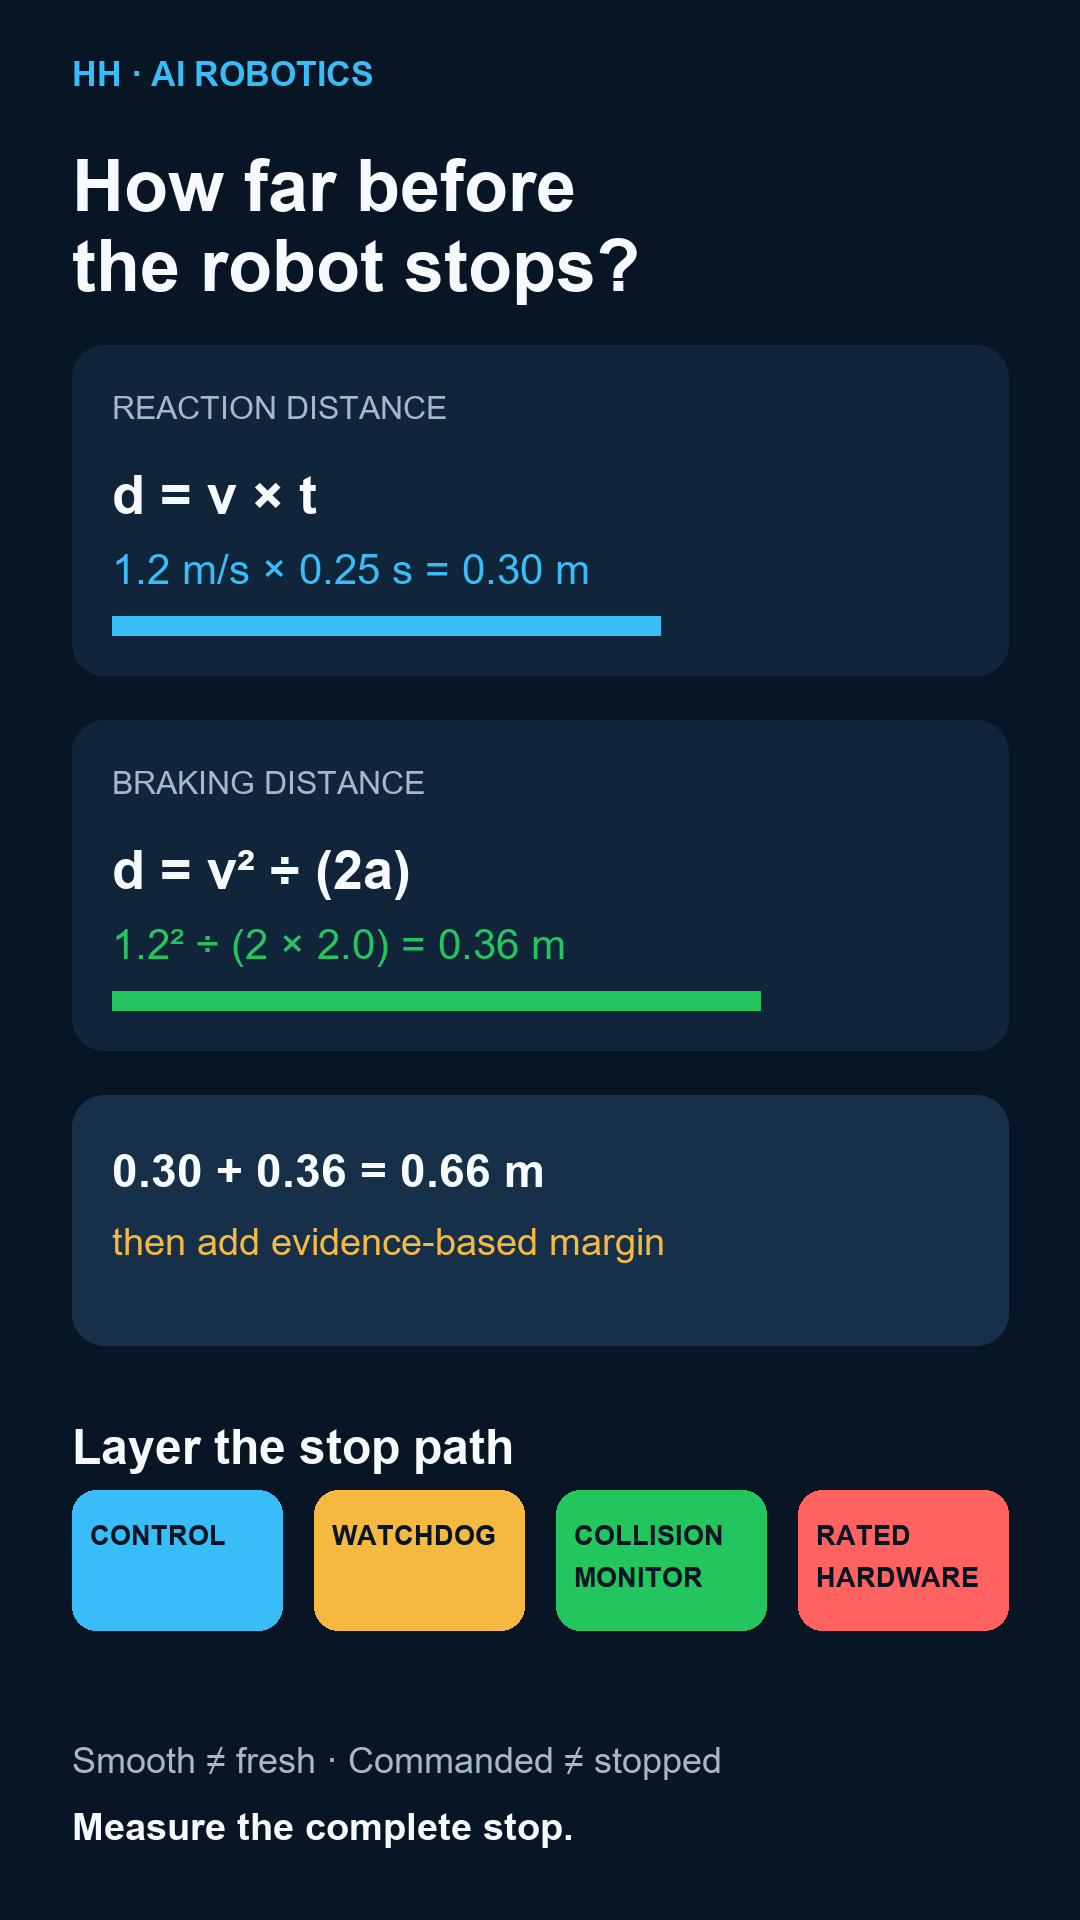
A rover travels at v = 1.2 m/s. Its end-to-end reaction delay is t = 0.25 s. Once braking begins, its measured deceleration is a = 2.0 m/s².
Reaction distance:
d_reaction = v × t = 1.2 × 0.25 = 0.30 m
Idealized braking distance under constant deceleration:
d_brake = v² / (2a) = 1.2² / 4.0 = 0.36 m
Nominal stopping distance:
d_stop = d_reaction + d_brake = 0.66 m
That is not yet a safety boundary. Real designs add evidence-based margin for timing variation, surface changes, measurement error, actuator limits, and uncertainty. Test the complete stop path under worst credible conditions.
Suppose a range sensor alternates between 0.98 m and 1.02 m around a stationary obstacle. That is noise. Suppose it consistently reports the obstacle position 200 ms late. That is delay. A median or low-pass filter can reject spikes, but filtering old samples more heavily may increase effective delay. Evaluate both jitter and age.
A smooth range signal is 400 ms old. Is it trustworthy for a fast stop? Explain using both accuracy and freshness.
If a controller requests -1.0 braking but the drive can apply only -0.5, the applied command—not the request—sets deceleration. Log both. One successful stop on a high-friction floor does not prove the same stop on dust, carpet, slope, low battery, or payload change.
Stopping evidence is a budget: perception and computation consume time, the robot travels during that time, and braking consumes distance. Treat noise, delay, saturation, watchdog behavior, and recovery as measurable parts of one safety case.
Compare stopping distance across speed, delay, and braking conditions, then defend a conservative stop-zone threshold.
lab-worksheet.csvreaction_distance = speed × delay.braking_distance = speed² / (2 × deceleration).Stopping distance grows linearly with reaction delay and quadratically with speed in the idealized braking term. The combined adverse condition should require the largest zone. A defensible design uses measured worst-case timing and braking evidence rather than a single nominal trial.
Add a distribution of measured delays instead of one value. Choose a percentile or upper bound and explain the residual risk.
Describe each row verbally as reaction travel, braking travel, margin, and final zone. A graph is optional.