Lesson reading
live
28 min
Start with the lesson question, connect the representations, and test the model with evidence.
Inspect the opening phenomenon
Predict what changes, then name the evidence.
Apply in the lab
Name the evidence before reading the answer.
Read only what helps
Then use the lab and recall check.
More when needed
Transcript and resources stay available below.
Course progress
Interactions, Phases, Gases, and Solutions
Decision challenge
Use the opening example to make a prediction, identify evidence, and explain which model supports it.
Predict which liquid evaporates faster and name the particle-level evidence you need.
Compare complete molecular structures and interaction networks rather than relying on a single force label.
Before
Predict which liquid evaporates faster and name the particle-level evidence you need.
During
Track how interaction networks change vapor pressure without breaking covalent bonds.
After
Explain why boiling separates intact molecules and why evaporation cools a liquid.
Lesson reading
live
28 min
Video script
draft
Transcript fallback
available
courses/ap-chemistry/modules/03-properties-of-substances-and-mixtures/lessons/01-interactions-phases-gases-and-solutions/video-transcript.md
Interactions, Evaporation, and Solution Evidence
approved
1 hr 30 min
Mastery check
live
6 questions / 15 min
Ethanol and water are both small polar molecules, so why does ethanol evaporate faster? Both have dispersion forces and hydrogen bonding, but water builds a more extensive hydrogen-bond network. More energy is needed to separate its molecules. At the same temperature, fewer water molecules have enough energy to escape, so water has the lower vapor pressure and higher boiling point. Evaporation removes higher-energy particles, which cools the remaining liquid. Quick check: does boiling break the O–H covalent bonds inside water molecules? No. Boiling separates intact molecules by overcoming intermolecular attractions. Compare complete particles, not just one force label. Learn the full AP Chemistry model chain free at EduQuest AI.
Reading lab
Connect the lesson's words, diagrams, graphs, evidence, and equations.
How can particle identity, attractions, motion, and distribution explain boiling, gas behavior, dissolving, separation, and light absorption?
Intramolecular bonds connect atoms within a particle. Intermolecular forces (IMFs) are attractions between particles. Separating molecules during vaporization overcomes intermolecular attractions; it does not normally break covalent bonds.
All atoms and molecules exhibit London dispersion forces because their electron clouds fluctuate. Larger, more polarizable electron clouds generally produce stronger dispersion forces. Polar molecules also experience dipole–dipole attractions. Hydrogen bonding is a particularly strong, directional dipole interaction when hydrogen bonded to N, O, or F interacts with a lone pair on N, O, or F of another particle.
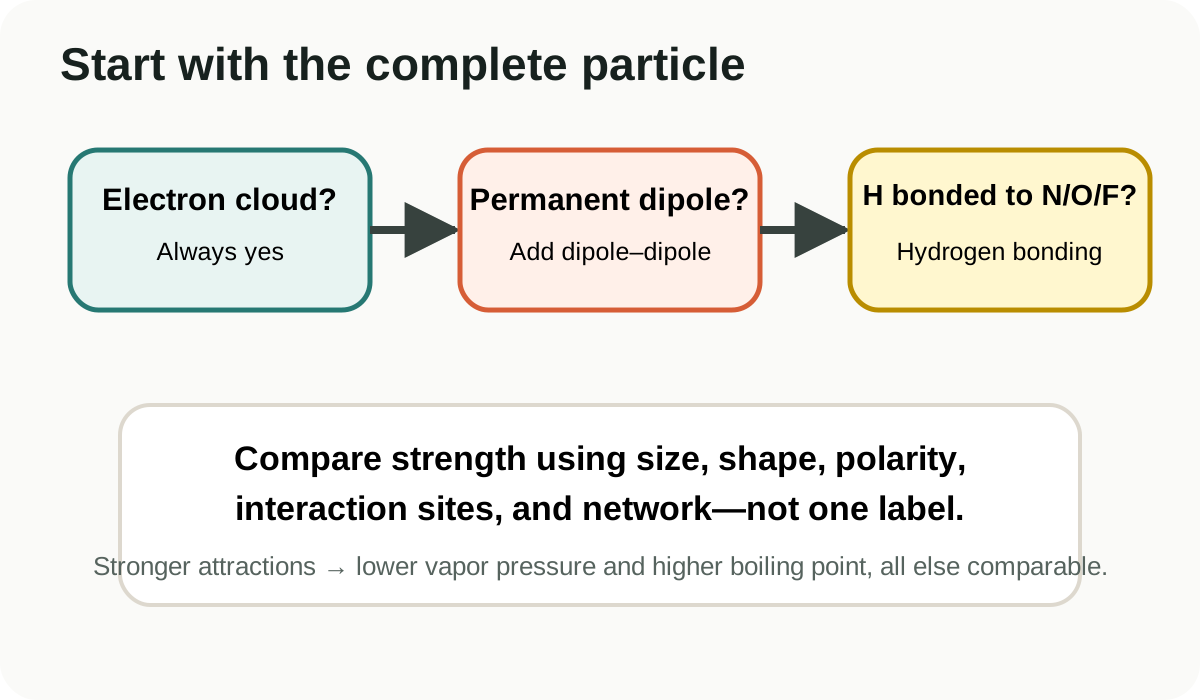
For comparable substances, stronger attractions usually mean lower vapor pressure and higher boiling point. Size, shape, and total interaction sites matter, so naming one force is not enough: compare the complete particles.
A liquid in a closed container establishes dynamic equilibrium when evaporation and condensation rates become equal. Vapor pressure increases with temperature because a larger fraction of particles has enough kinetic energy to escape. Boiling occurs when vapor pressure equals external pressure; lowering external pressure lowers the boiling temperature.
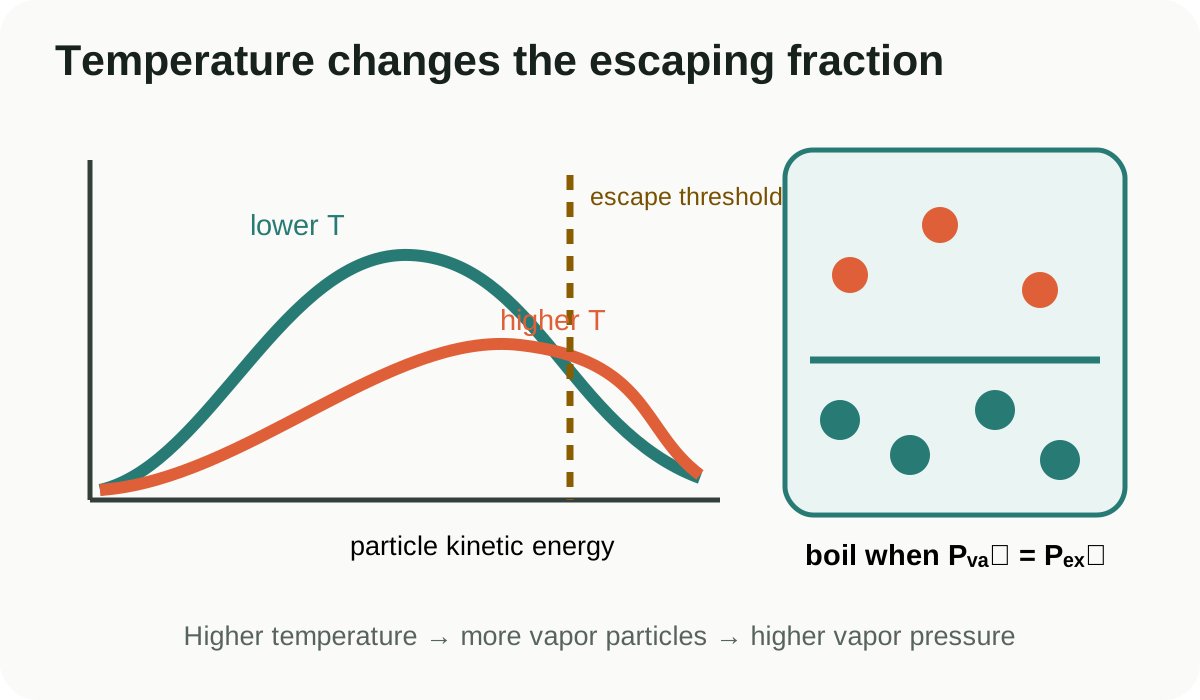
During a phase change at constant pressure, added energy changes particle separation and potential energy rather than average kinetic energy, so temperature remains approximately constant until the transition finishes.
The ideal-gas equation connects measurable state variables:
Use consistent units. With , use liters, atmospheres, moles, and kelvin. Gas pressure arises from particle collisions with container walls. At the same temperature, gases have the same average translational kinetic energy; lighter particles have a greater root-mean-square speed.
Real gases deviate most at high pressure and low temperature, where particle volume and attractions are no longer negligible.
A ideal gas occupies at . Its pressure is
The units cancel to atmospheres. The result is reasonable because the chosen state is near ordinary laboratory pressure and temperature.
A solution forms when solute–solvent attractions compensate for separating solute particles and solvent particles. “Like dissolves like” is a useful shortcut, not a mechanism. Ionic solutes can dissolve in polar water through ion–dipole attractions; nonpolar solutes tend to mix better with nonpolar solvents through dispersion forces.
Molarity is amount of solute per solution volume:
For dilution with no solute lost, . This is solute conservation, not a new chemical law.
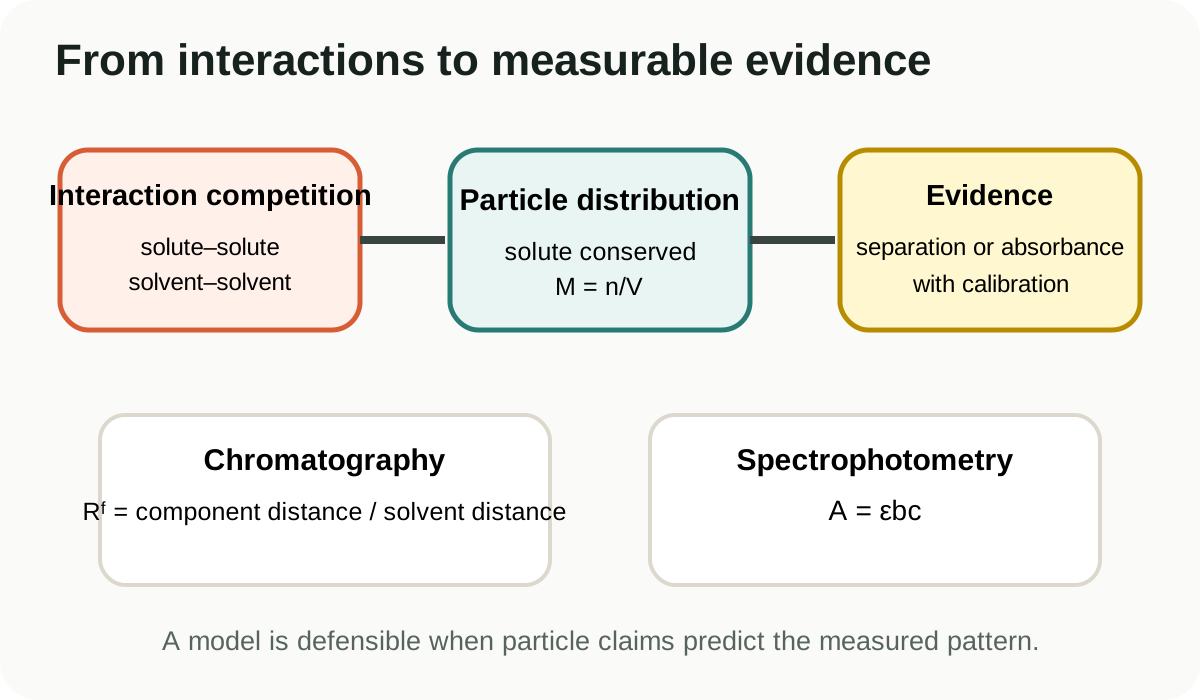
Chromatography separates components because they partition differently between mobile and stationary phases. Spectrophotometry connects absorbance to concentration over a valid calibration range:
Absorbance is dimensionless; is path length and is concentration. A calibration graph is stronger evidence than assuming ideal linearity at every concentration.
Particle attractions, motion, and distribution jointly explain observable properties. Strong explanations identify the particles, compare interactions, state model assumptions, track conserved quantities and units, and connect evidence to a suitable representation.
How strongly can evaporation behavior and paper chromatography support claims about particle interactions and mixture components?
Complete this investigation in a supervised chemistry laboratory. It contributes to laboratory experience only when a qualified instructor approves the materials, procedure, risk assessment, and waste plan. A simulation/data alternative supports access but does not replace required supervised hands-on AP laboratory work.
Wear splash goggles and closed-toe shoes. Keep alcohol solutions away from flames, sparks, and hot surfaces; work with the smallest practical quantities in instructor-approved ventilation. Do not taste or deliberately inhale any sample. Clean splashes promptly. For eye exposure, use the eyewash for at least 15 minutes and notify the instructor; for fire or significant spill, stop work and follow the site's emergency plan. Consult current SDS documents and institutional rules before starting.
Collect alcohol-containing liquids and used chromatography solvent as directed by the instructor; do not pour them into a drain unless the institution explicitly permits it. Place paper and contaminated disposables in the designated waste container. Return reusable equipment clean and wash hands.
Use instructor-supplied time–temperature and chromatogram images, tactile/large-print rulers, color-independent labels, and a spreadsheet or sonified graph. Students should still make predictions, analyze uncertainty, and defend claims.
More volatile approved mixtures generally show faster evaporation and greater evaporative cooling under controlled conditions. Chromatography resolves some marker mixtures into reproducible component bands with distinct values. Results depend on composition and experimental conditions, so claims must include uncertainty and limitations.
Design a calibration experiment that tests how changing mobile-phase composition affects for one marker component while holding paper type, development distance, temperature, and spot size constant.